In a previous article in this series, I explained the key elements needed to create the ‘perfect’ digital marketing plan. Within this, a digital marketing dashboard is an important foundation of a data-driven approach since this helps to keep your strategy on track by regularly reviewing your performance against objectives.
In this article, I’ll look in more detail at how this dashboard should be structured. I’ll start by recommending the essential digital marketing metrics to include for review and then look at some other requirements in common with other marketing and business dashboards.
Which digital marketing KPIs should we include?
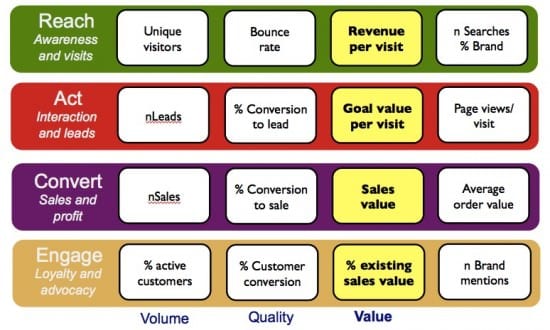
To check that you have right types of performance measures, including both site visitor measures from analytics plus more commercial measures related to leads and sales, check your digital dashboard against the VQVC mnemonic combined with the Smart Insights RACE digital marketing planning system as shown in the visual. RACE is a helpful framework to use for creating digital KPI dashboards since it gives a simple structure to cover the whole of the marketing funnel for different types of business, even if they are not selling online.

VQVC is a powerful mnemonic which can be used to review your objective setting and also check you have the right types of metrics to review performance on a dashboard. Often basic dashboards I have seen businesses use tend to only use Volume measures like the number of visitors to a website, but the quality, value and cost of attracting visits should be included also as shown in the visual.
Typical VQVC measures of website visits and interactions to think about including are visitor…:
- Volume measures like unique visitors, visits and pageviews
- Quality measures such as conversion rate to lead or sales, bounce rate and duration. The dashboard you select should make it possible to display different multichannel marketing goals that you may have customized in Google Analytics, for example for leads or site registrations or sales for a transactional e-commerce site.
- Value measures include Goal value per visit and revenue per visit and overall revenue and profitability for transactional sites.
- Cost measures are historically limited in Google Analytics, however, you should consider overall cost. You can find Google Ads costs in Google Analytics and import information about product costs.
Customer satisfaction is another key type of measure to include in marketing dashboards, but this is usually reported on less frequently for digital marketing for non-transactional websites, typically through annual surveys.
Digital KPI breakdown?
The measures in the visual work well for a top-level dashboard, but to make it actionable, when comparing performance between different time periods, a more actionable dashboard will enable you to drill down beyond the headline figures. You will then be able to understand reasons why you may have fallen behind or exceeded performance.
For business dashboards, you often need to break out figures by markets and products. Likewise with digital dashboards, breaking down website metrics by different geographical markets or product categories is useful.
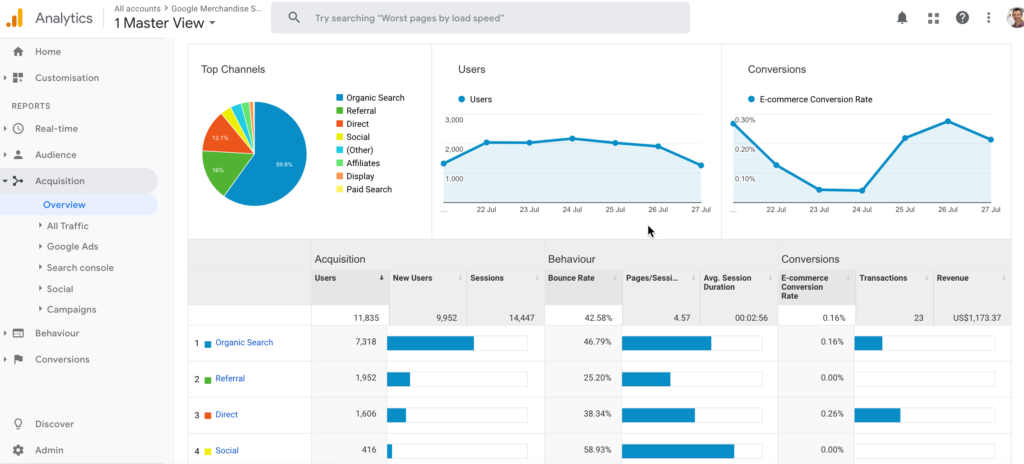
For digital marketing dashboards also including channel performance is essential so that you can see how the volume, quality and value from different traffic sources to a website compare. For example, this Google Analytics acquisition report from the Google Demo account shows how organic search is the most important channel by volume and is contributing conversions, but some of the other channels aren’t delivering conversions in the time period, so should be investigated.
Some form of channel performance dashboard similar to this should be included in part of a digital dashboard:

Business requirements for an effective dashboard
Other essential features of a digital dashboard that are shared in common with business dashboards:
- Comparing performance through time – Although time comparisons are possible in Google Analytics, the standard reports don’t readily show the differences or deltas between time periods. KPIs should be compared through time using month-on-month and year-on-year so that changes in organic search, for example, can be readily seen.
- Comparing performance against target – Business dashboards will compare actual performance of sales against forecast target sales, typically on a monthly basis. If a business is serious about data-driven marketing, it will find a way to incorporate targets for digital channels each month into the dashboard.
- Commentary and annotations – Where dashboards are circulated to colleagues or clients as regular weekly or monthly reports, there should be a method to highlight and explain variances from what is expected to learn from these. A simple form of this is adding annotations in Google Analytics, for example, to show changes to features on the website or campaign start dates.
- Existing vs new customers – By default, Google Analytics will only show anonymous visitors, but if you have a transactional website with signed-in customers you will want to see visits and sales from new against existing customers so that you can review incremental growth of visitors. This is another form of KPI breakdown.
How to create your digital dashboard
From the requirements of a dashboard that I have laid out, it’s clear that the standard or custom reports in Google Analytics won’t cut it. So you need to consider other services for creating your dashboard. You will be able to use data available through the Google Analytics API to display VQVC data from Google Analytics.
Of the paid services, Tableau is perhaps the best-known business dashboard tool which will use the API to display Google Analytics data. There are also many paid services like Supermetrics, Klipfolio or DashThis specifically for creating digital marketing dashboards which will also display data from other feeds like Facebook or Google Ads for more details on these channels.
For free digital dashboards your best options are from Google. These are:
- Google Sheets Add for the Google Analytics API – We created the Smart Insights RACE digital dashboard using the free Sheets Add-on. This has many of the features of the perfect digital dashboard such as reporting of goals by channels and month-on-month vs year-on-year comparison.
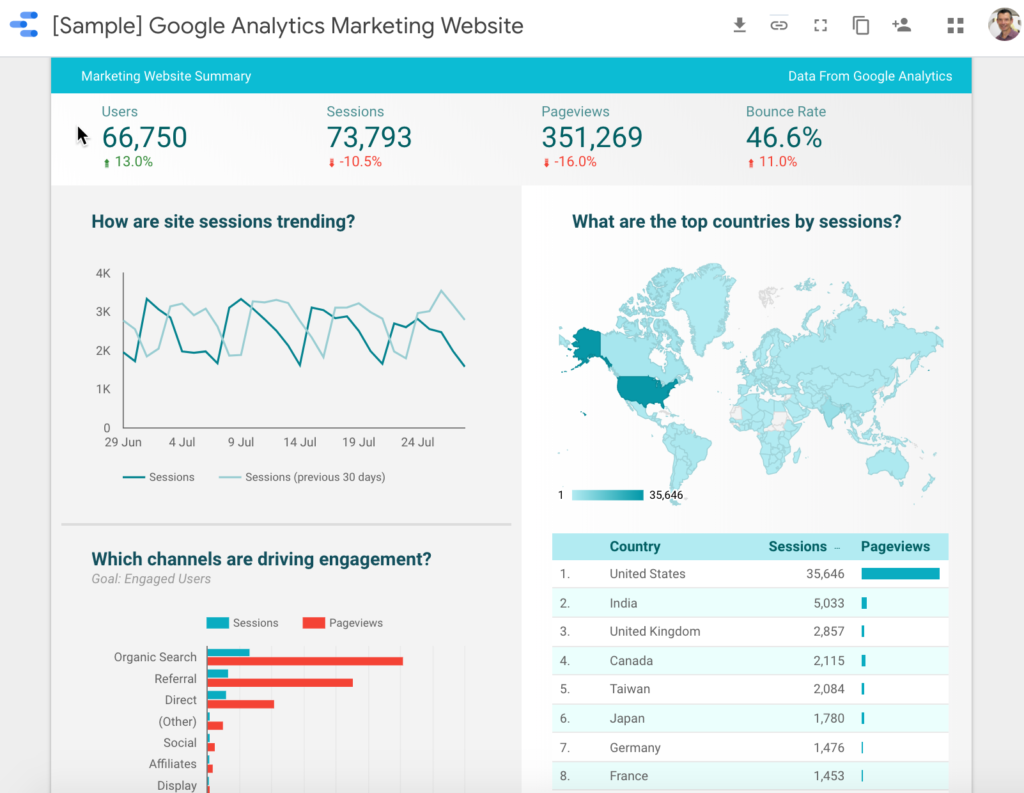
- Google Data Studio – This relatively new tool also makes it easy to show time comparisons and display different goals and channel breakdowns. Check out the Data Studio Gallery for examples of digital dashboards you can use as the basis for your dashboards, or to learn how to use the service. Here is an example to show you how the visualizations differ from Google Analytics.


