Conversion rate is almost a self-explanatory term, but when benchmarking conversion, it’s important to consider the denominator. Are you dividing sales by number of unique visitors or visitor sessions?
In Google Analytics, which can be considered the standard reference sales are divided by number of sessions. E-commerce Conversion Rate is defined by Google as:
“The ratio of transactions to sessions, expressed as a percentage. For example, a ratio of 1 transaction to every 10 sessions would be expressed as an Ecommerce Conversion Rate of 10%”.
This is E-commerce conversion rate. For other businesses, conversion to lead is used.
See the Smart Insights digital marketing conversion rate benchmark for examples of different types of conversion rates including business-to-business.
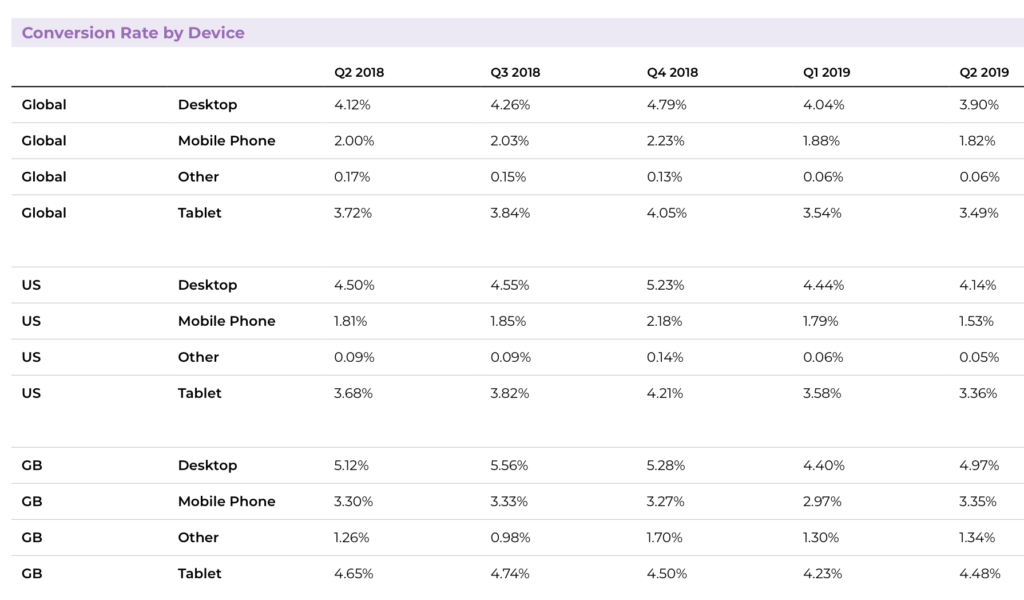
How do conversion rates vary between smartphone and desktop
Monetate has good quality benchmarks of e-commerce conversion rates for their UK and US customers.

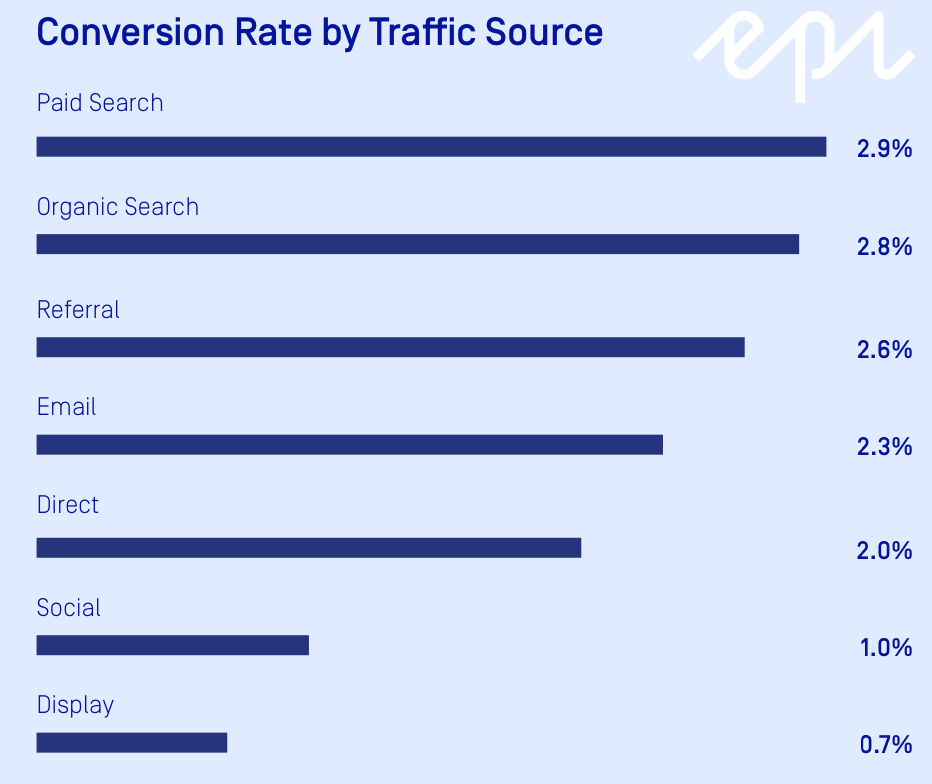
How do conversion rates vary by channel
This new 2019 research from Episerver retail clients (based on 1.3 billion unique shopping sessions across 159 unique retail and consumer brand websites) shows a typical pattern. Conversion rates are significantly higher where consumers have higher intent, i.e. they are searching for products. This compares to social and display referrred visits where conversion rates are significantly lower.


